SpectroBits
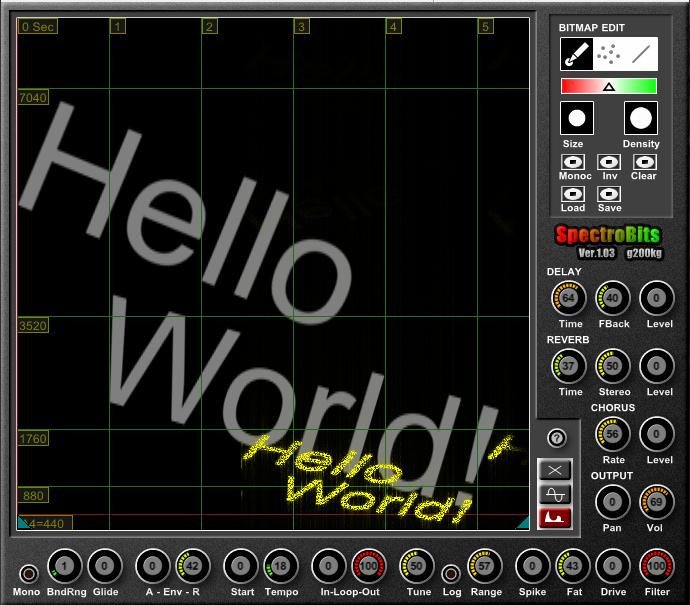
SpectroBits interprete the image as a “Spectrogram“, that means X-Axis as time, Y-Axis is frequency (but the MIDI note determine the base-note).The black pixel is silent. The bright pixels means strong harmonics for that freq.
The “A4=440” (red) line means 440Hz if you play the note ‘A4’.
“880” line is 880Hz if you play the note ‘A4’, and so on…
About colors, Red for L-ch and Green for R-ch. Blue is ignored.
The image can be edit by right upper “BITMAP EDIT” section. You can also import any images of “.bmp”, “.png”, “.jpg” and “.gif”. Image size is fixed to 512×512. Any images are resized automaticaly to 512×512 if you import.

![]()
![]()
spectrobits103 ( 2.08 MB )

